This is an informational/diagnostic panel that displays operational statistics on a number of the key subsystems and device drivers within the system. For example, it can show the current CPU / amplifier temperatures, memory / flash utilization, or Ethernet transactions. This is a simple means of executing commonly used Console commands.
| System Console Panel Overview | |
|---|---|
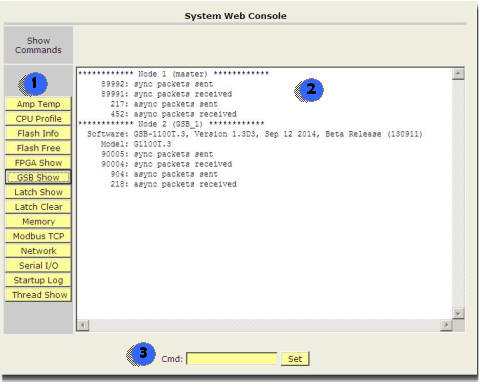
1. Show Console Commands | Pressing a button in the left panel issues a predefined "Show" Console command to the controller. Please see the Controller Software > Software Reference > Console Commands section for more information about information that can be returned by specific commands For example, |
2. Results Display | The information returned by the last button press is displayed in this window. |
3. Manual Console Command entry | If you wish to execute an arbitrary Console Command, the full command string should be entered into the Cmd box and "Set" pressed to invoke the command. |