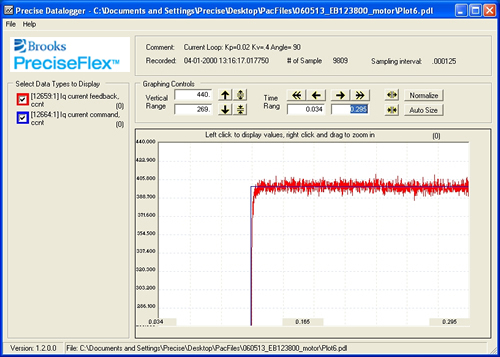
In the following graph, note the ‘current feedback’ spike during the rise of the ‘current command’. This spike can cause an amplifier or over-current fault when running a motor at moderate speeds or during high accel/decel operations.
This spike indicates that there is not enough Kv (DataID 10657) or to much Kp (DataID 10656).
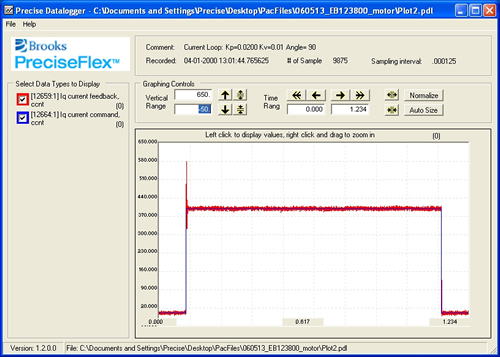
The following plot shows a current loop response curve where the actual current never reaches the desired commanded current.
It is most likely due to having Kp (DataID 10656) too small. Try increasing Kp.
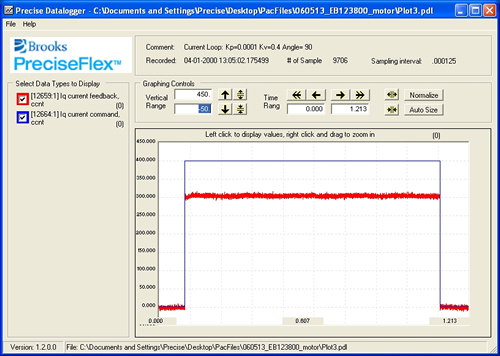
The following plot is typical of situations where the Kv value (DataID 10657) is set too high. Note that the rise time of the actual current is slow relative to the command and that the current oscillates during the steady state period.
Try lowering the ‘Kv’ to improve the motor current response.
Increasing the ‘Kv’ normally helps to dampen a spike in an under damped situation, but too high a value can reduce the responsiveness of the system and cause oscillations in the current loop. These deficiencies can result in difficulty in tuning the PID position loop.
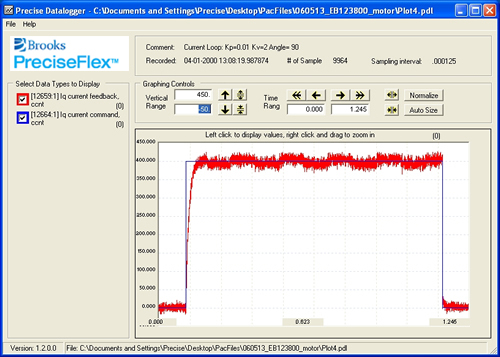
In the following test, the rise time of the current is very rounded at the beginning of the command. Although some rounding always occurs, too much will cause sluggish performance.
The goal should be to have the current rise to 90% of the commanded value in approximately 2-5 msec. This is not possible with all motors, but can be achieved with most motors.
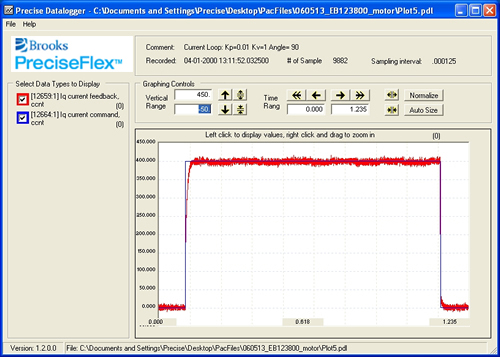
Expanding the beginning of this plot, as seen below, illustrates that it takes approximately 15 msec to reach the 90% mark on the graph.
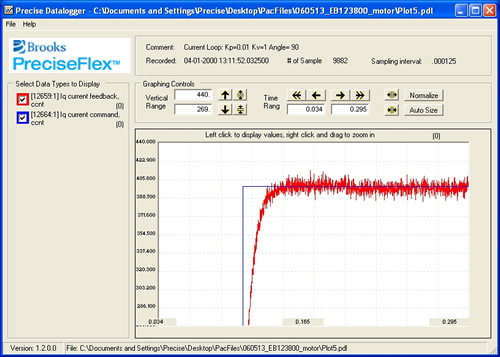
The following plot shows an expanded view of a motor that has been properly current looped tuned. Note that the actual current rises to 90% of the command in about 3 msec and there is not overshoot and no significant oscillations in the steady-state section.